Understanding the data quality results
Introduction
This overview is supplementary to the Data Quality Framework Overview and is intended to provide a more detailed level of support and direction in reading and understanding the results of the Data Quality results.
Any relevant current industry guidance and case studies have been referenced, where they provide more detailed assistance.
The Expected Standard
The result for each metric is considered against grade thresholds providing an indication of the level of quality. Consideration has been made for idiosyncrasies between the data and tests applied in setting these thresholds. The grades are:
| Grade |
Description |
| Grade 1 |
Data to the expected standard |
| Grade 2 |
Minor data quality issues present |
| Grade 3 |
Major data quality issues present |
Structure of the results
Transport Insights presents the annual data quality results for each RCA. You can view, filter and order the results to assist analysis and the development of any data improvement plan. For the State Highway network, the results are also reported at the State Highway Region level. The results are reported the following ways:
- The percentage of metrics at each of the three grade ranges aggregated to an overall RCA, quality dimension, importance and data category level
- A weighted Score based on metric importance and grade achieved
- At an individual metric level
Dashboard Results
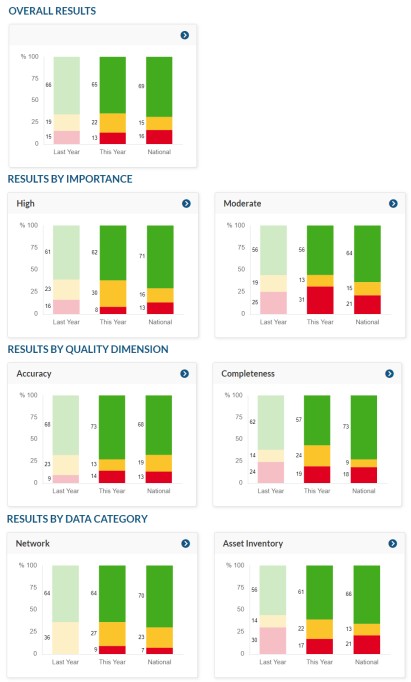
The individual RCA or State Highways Region metric results are aggregated to an overall result plus results for each quality dimension, level of importance and data category.
These are presented as percentage within each grade range for the individual RCA and how this compares with the individual RCA’s result for last year. The individual RCA’s results can also be compared to the national, peer group and regional average.
|
|
 |
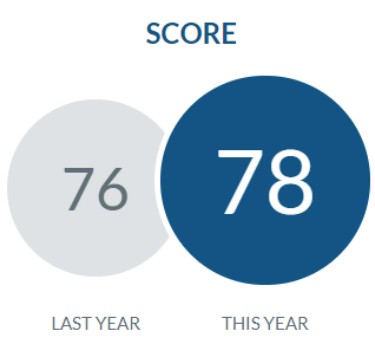
Overall Score
Each data quality metric is assigned an importance of high, moderate or low.
The different levels of importance reflect the criticality of this data in our asset management and decision-making processes. These are used to generate the overall "Score" shown at the top of this page. The overall "Score" result is out of a maximum of 100. It is derived from the RCA's individual results for each applicable metric and reported on their data. It is a weighted score based on the level of importance of each metric. High importance metrics contribute the greatest, then moderate and low contribute the least. A score of 100 is achieved by having all metric results at the expected standard. More detail on the SCORE CALCULATION can be found within the resources on the REG website.
|
|
|
|
Key Points
Understanding the data quality results:
- The annual data quality results for an individual RCA are available within the Transport Insights website
- The results are reported at an individual metric level and aggregated by quality dimension, category and overall
- The overall Asset Management “Score” is derived from the RCA’s individual results for each metric that are applicable, and reported, on their data
- At an individual metric level, the result of each RCA is reported against the national distribution and the grade thresholds
- Metric references denoted with a letter at the end are subsets of the same indicator (i.e. SURF1a and SURF1b). Their results are aggregated to report as a single indicator in the charts in the dashboard
- Consideration has been made for idiosyncrasies between the data and tests applied in setting the grade thresholds
- Some metrics may not be applicable to a network, i.e. those querying the rural network on an urban only network
|
| |
| The data quality metric results are reported individually and aggregated by quality dimension, level of importance, data category and overall RCA. |
| |
 |
|
Individual metric results
The below figure provides an overview of how to read the results for each metric.
Items of Note
|
Metric references denoted with a letter at the end are subsets of the same indicator (i.e. CWAY2a and CWAY2b). Their results are aggregated to report as a single indicator in the charts in the dashboard.
Trend indicators show the relative change in results between annual reports. An up arrow represents an improvement in the metric result of at least 5%, a down arrow for a decrease of at least 5%, and a no change indicator if the result change is between a decrease of 5% and an improvement of 5%.
|
|
There are two scenarios where some metrics may not be applicable to a specific RCA. These will display a result of "NA", will not be coloured in line with the grade ranges and do not contribute to the aggregated results on the dashboard. The scenarios are:
- Those not applicable based on network definition, i.e. metrics querying the rural network on an urban only network.
- When the achieved quantity recorded in TIO and asbuilted quantity recorded in RAMM are both NULL or zero. If the achieved quantity is zero and the as-builted greater than zero, or vice versa, a result of 0.0 is reported.
|
Relevant Links
REG Data Quality project (external link)
Data Quality Framework overview (help page)
Data Quality dimensions overview (help page)
Calculating the data quality score (help page)
Metric Library (internal link)