Descriptions of the Measures
Safety Technical Output 9 - Vulnerable Users
The number of reported serious injuries and fatalities (DSI) involving vulnerable users on the network
The aim of this measure is looking for a reducing trend in the number of serious and fatal injuries to vulnerable road users.
Reported Crashes are recorded in the Crash table and vulnerable users are identified from a combination of Vehicle Types and Movement Codes. This measure identifies Crashes where one of the following applies: From the Crash Analysis System vehicle table select where the vehicle type is in the following list:
- M (Motor Cycle)
- P (Moped)
- S (Bicycle)
- H (Wheeled Ped)
From the Crash Analysis System crash table select where Movement Codes are in the following list:
- mvmt_ida = N (Ped Xing Road) and all values for mvmt_idb
- mvmt_ida = P (Other Ped) and all values for mvmt_idb
- mvmt_ida = Q (Misc) and mvmt_idb = E (VEHA DIRN hit horse)
Reported crashes are recorded in the Crash table and the report groups the data for the last 5 complete financial years. Financial years are considered complete after details of a Crash are imported into the Performance Measures Reporting Tool for the following financial year.
Crashes are allocated to road section(s) based on the Location of the crash. If a crash is located at the start of one road section and the end of another road section, it will be allocated to the section of road section which starts where the crash is located.
The comparative trend graph expresses the vulnerable users trend as a percentage of the average crash rate for the previous five financial years, ignoring the current incomplete year. This creates a trend value that is based on the change in crash rate relative to the size of the network (average crash rate). We use this figure to allow comparison between large and small networks.This trend is shown calculated for your network, Peer Group , Region and the Nation . Negative values, shown in green, indicating a decreasing or improving trend. Positive values, shown in red, indicate an increasing or worsening trend.
This report assembles the most recent complete five year period of crash data for each Road Controlling Authority (RCA) used in the report.
To do this the most recent complete financial year is found and the five years up to that date is included. This is done for your RCA and RCAs in any peer groups, regions and to nationally.
The diagram below shows how this might work for a sample RCA.
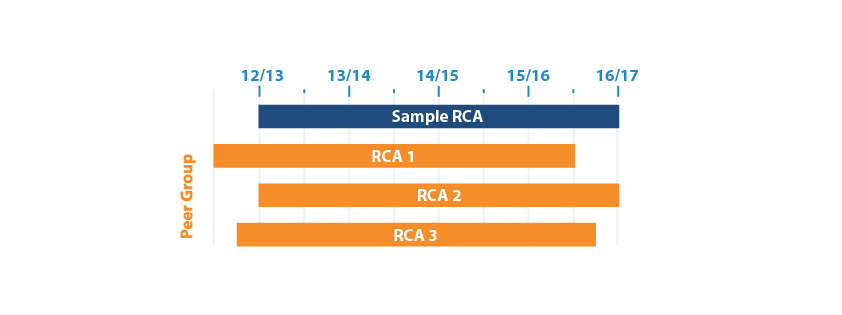
 If there is data for the next financial year, then this financial year is considered complete.
Problems with your Crash data?
• Learn more about Crash Analysis System.